Skip to main content
Search
Toggle navigation
Main navigation
National Comprehensive Center
Regional Comprehensive Centers
Our Work
Impact Stories
Resource Library
Get Involved
Search
Search
Submit Search
Resources
Resource Library
Resource Library: Archived
Resource Library: Archived
Search
Submit Search
Displaying 1 - 14 of 14
Comprehensive Standards-Based Assessment System: Achieving Balance
Type:
Infographic
Year:
2017
Source:
Center on Standards and Assessment Implementation
Topic(s):
Formative Assessment, Classroom-Based Assessment, Every Student Succeeds Act (ESSA)
Format:
PDF
Open
Adventures in Reading - AR Chronicles: Issue #1
Type:
Infographic
Year:
2018
Source:
National Center on Improving Literacy
Topic(s):
Literacy, Classroom-Based Assessment, Diverse Learners
Format:
PDF
Open
Formative Assessment Process Graphic
Type:
Infographic
Year:
2017
Source:
Center on Standards and Assessment Implementation
Topic(s):
Formative Assessment, Learning & Instruction
Format:
PDF
Open
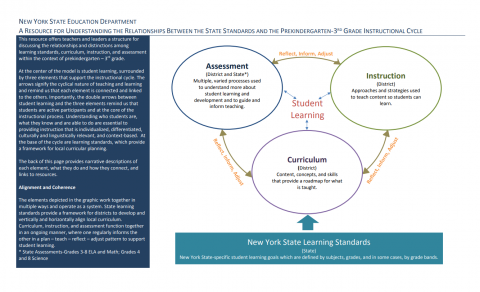
A Resource For Understanding the Relationship Between the State Standards and the Prekindergarten-3 rd Grade Instructional Cycle
Type:
Infographic
Year:
2017
Source:
Northeast Comprehensive Center
Topic(s):
Early Learning, Learning & Instruction, Accountability & Assessment, Standards & Curriculum
Format:
PDF
Open
Implementation Process
Type:
Infographic
Year:
2017
Source:
Midwest Comprehensive Center
Topic(s):
Planning & Management, Innovation, Data Use
Format:
PDF
Open
Equitable Access Toolkit: Stakeholder Engagement Guide
Type:
Infographic
Year:
2014
Source:
Center on Great Teachers and Leaders
Topic(s):
Stakeholder Engagement, Equity, Data Use
Format:
Word
Open
Why Is Career and Technical Education (CTE) Important for Employment Success for Students With Disabilities?
Type:
Infographic
Year:
2017
Source:
College and Career Readiness and Success Center
Topic(s):
Career & Technical Education, Students With Disabilities, Program Evaluation
Format:
PDF
Open
Percentages of 8th Grade Students At or Above the Proficient Achievement Level for Reading on the National Assessment of Educational Progress (NAEP)
Type:
Infographic
Year:
2015
Source:
South Central Comprehensive Center
Topic(s):
Outcome Measures, Standards & Curriculum
Format:
PDF
Open
Percentages of 8th Grade Students At or Above the Proficient Achievement Level for Mathematics on the National Assessment of Educational Progress (NAEP)
Type:
Infographic
Year:
2014
Source:
South Central Comprehensive Center
Topic(s):
Outcome Measures, Science, Technology, Engineering, Mathematics (STEM), Standards & Curriculum
Format:
PDF
Open
Percentages of 4th Grade Students At or Above the Proficient Achievement Level for Mathematics on the National Assessment of Educational Progress (NAEP)
Type:
Infographic
Year:
2014
Source:
South Central Comprehensive Center
Topic(s):
Outcome Measures, Science, Technology, Engineering, Mathematics (STEM), Standards & Curriculum
Format:
PDF
Open
Percentages of 4th Grade Students At or Above the Proficient Achievement Level for Reading on the National Assessment of Educational Progress (NAEP)
Type:
Infographic
Year:
2014
Source:
South Central Comprehensive Center
Topic(s):
Outcome Measures, Standards & Curriculum, Diverse Learners
Format:
PDF
Open
Formative Assessment Planning Guide: Library/Media Grade K
Type:
Infographic
Year:
2016
Source:
Center on Standards and Assessment Implementation
Topic(s):
Formative Assessment
Format:
PDF
Open
The American Indian Achievement Gap
Type:
Infographic
Year:
2014
Source:
Center on Standards and Assessment Implementation
Topic(s):
American Indian/Alaska Native, Equity, Outcome Measures
Format:
PDF
Open
CSAI Implementation to Support Student Learning
Type:
Infographic
Year:
2015
Source:
Center on Standards and Assessment Implementation
Topic(s):
Diverse Learners, Alignment, Accountability & Assessment
Format:
PDF
Open